


NewsInformation Center
Mask Filter Efficiency test of Materials and methods
2020/07/10
Share:
Test materials

Six NIOSH-approved N95 FFR models, three surgical N95 FFR models and three SM models were chosen from the United States Strategic National Stockpile or from respirator manufacturers known to have significant market share. The manufacturers and models in parentheses are: N95 FFRs - 3M (Model 8210), 3M (Model 9210), Moldex (Model 2200), Kimberly-Clark (Model 62126), Sperian-Willson (Model SAF-T-FIT), and US Safety (N95B240); surgical N95 respirators - 3M (Model 1860), 3M (Model 1870) and Kimberly-Clark (Model 46727); SMs - 3M (Model 1820), Kimberly-Clark (Model 47107) and Precept (15320). The N95 FFRs were labeled randomly as A, B, C, D, E, and F, the surgical N95 FFRs as G, H, and I, and the SMs as J, K, and L. None of the N95 FFRs or surgical N95 FFRs had an exhalation valve. Surgical N95 FFR models H and I were specifically chosen, because they appear to be identical to two N95 FFR models (B and E).
Area of test materials and face velocity or test material area, face velocity, and configuration
Table 2 shows the area, face velocity and configuration of masks used in the NIOSH NaCl, PFE, BFE, and VFE methods. Entire N95 FFR models (except model E) and surgical N95 FFR models (except model I) were tested in all four test methods. The area of other masks tested were different, because the nature of the fabric materials and the construction of some models did not permit the entire mask be tested. Also, it was difficult to fit some masks into the normal sample holders used for some test methods. The surface area of a typical FFR was approximately 150 cm2 as measured manually. Based on the area of the entire FFR and flow rates used for testing, face velocities 9.3 and 3.1 cm/sec were obtained for the NIOSH NaCl method, and for the other (PFE, BFE, and VFE) methods, respectively. SM models were not tested in their entirety, but samples of 100 cm2, 90 cm2, 45 cm2 and 45 cm2 areas were tested for the NIOSH NaCl, PFE, BFE and VFE measurements, corresponding to 14.2, 5.2, 10.5 and 10.5 cm/sec velocities, respectively. Filtration efficiency tests for N95 FFRs, surgical N95 FFRs and SMs were performed by a third party independent (TPI) laboratory. Five samples of each model were tested for filter penetration separately using the NIOSH NaCl, PFE, BFE, and VFE methods. From the mean penetration value, the percentage efficiency was calculated for each model.
NIOSH NaCl filtration efficiency
Filter penetration for all devices was measured using the NIOSH NaCl aerosol method employed for certification of particulate respirators using an Automated Filter Tester (CERTITEST?, Model 8130, TSI, Inc., St. Paul, Minnesota). The samples were pre-conditioned at 85 ± 5% relative humidity and 38 ± 2.5°C for 25 ± 1 hr prior to measuring filter penetration. A 2% (wt/vol) NaCl solution was aerosolized, charge neutralized and then passed through the convex side of a test sample properly sealed and placed into a filter holder. The particle size ranges from 0.022–0.259 ?m with a count median diameter of 0.075 ± 0.020 ?m and a geometric standard deviation (GSD) of less than 1.86.[7] The concentrations of NaCl aerosol upstream and downstream of the sample were measured at 85 L/min flow rate. The full NIOSH certification test typically takes approximately 90–100 min to load 200 mg of NaCl aerosol onto the respirator. In this study, we used an abbreviated method in which testing was stopped when the sample reached its maximum penetration level rather that continuing until the respirator was fully loaded with aerosol. Thus, the time to reach maximum penetration was different between different masks, but was typically less than 15 min. A previous study in our laboratory found that efficiencies obtained by measuring initial penetration (average of the first minute) of N95 FFRs were comparable to those done at maximum penetration at full loading conditions.[34] The equipment was programmed to give the percentage filter penetration as shown below:
Penetration of each test sample was measured for 5 min or more time until maximum penetration was reached. For convenience and efficiency, doing the full loading test as done by NIOSH according to 42 CFR Part 84 during certification testing was not done in these experiments. From the percentage penetration, the efficiency was calculated as shown below:

Particulate filtration efficiency (PFE)
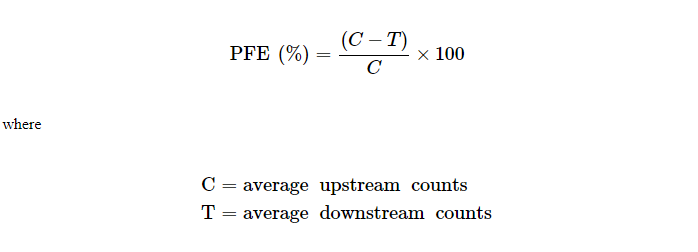
PFE of the different devices was measured using unneutralized 0.1 ?m PSL particles as per the FDA guidance document.[11] PFE testing was done using entire N95 FFRs and surgical N95 FFRs, and 90 cm2 surgical mask material. The test velocity was within the range 1–25 cm/sec as described in the ASTM 2299 method.[12] PSL particles were suspended in water and the aerosol was generated using a particle generator (Model PG-100) (Particle Measuring Systems (PMS), Boulder, CO). The particle generator can be adjusted to generate the desired concentration of particles for testing, which are enumerated using the particle counter downstream of the test sample. The aerosol was passed through a drying chamber, diluted to the required concentration (10,000–15,000 particles per cubic foot) using HEPA filtered air, and then passed through the convex side of a test sample properly sealed and placed into a filter holder. The particles were not charge neutralized for testing, per FDA guidance.[11] The test samples were preconditioned at 30–50% relative humidity (RH) at 21 ± 3°C, prior to testing.[12] The concentrations of PSL aerosol upstream and downstream of the respirator were measured using a Model LASAIR II-110 Laser Particle Counter (PMS) at 28.3 L/min flow rate. The upstream and downstream counts were not measured simultaneously, because the equipment measures either upstream or downstream at any time. Upstream count was measured before and after measuring downstream count for each test material. Both upstream and downstream counts were measured for 1 min, 3 times, sequentially. PFE was calculated from the average of six upstream counts (C) and the average of three downstream counts (T) as shown below:
PFE results range from 1–99.99% as these values are the low (<1) and high (>99.99) detection limits. Accurate data for surgical mask K could not be obtained because of excessive particulate shedding detected by the particle counter.
Bacterial filtration efficiency (BFE)
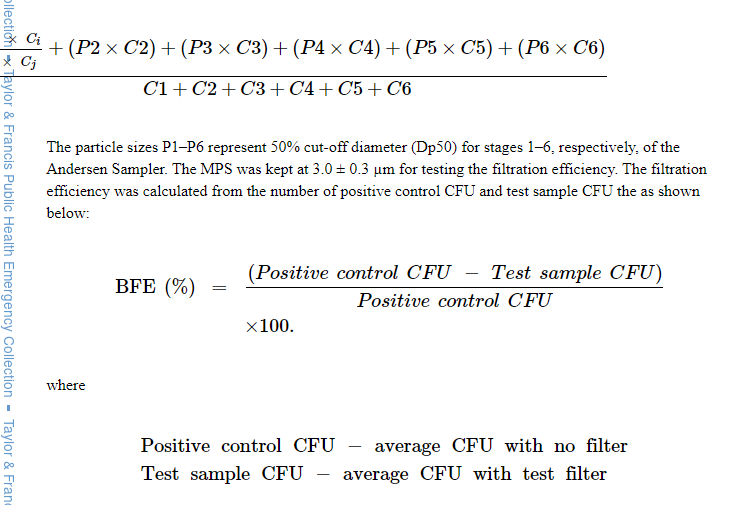
The BFE of the filter devices was measured as described by the ASTM F2101 method. Penetration was measured using the bacteria S. aureus as the challenge organism. A suspension of S. aureus was aerosolized using a nebulizer to give a challenge level of 1700–2700 colony-forming units (CFU) per test as specified by the ASTM F2101 standard. The bacterial aerosol is a water droplet containing the bacteria and not an individual bacterial particle. The particles were not charge neutralized for testing. The test samples were preconditioned for 4 hr at 21±3°C and 85±5% RH, prior to testing. The aerosol sample was drawn through a test sample clamped into the top of a 6-stage Andersen sampler with agar plates for collection of the bacteria particles at a flow rate of 28.3 L/min for 1 min. The design of 6-stage Andersen sampler is based on the human respiratory tract, where all airborne particles greater than 0.65 ?m are classified aerodynamically. The flow rate of 28.3 L/min is similar to human breathing flow rate to obtain deposition of particles in different stages of the Andersen sampler. A positive control without a test filter sample clamped into the system was used to determine the number of viable particles being used in each test. A negative control with no bacteria in the airstream was performed to determine the background challenge in the glass aerosol chamber prior to testing. In case of contamination, the testing system was cleaned thoroughly to reduce negative control CFU. The residual negative control (<1%) was subtracted from the test sample CFU. The positive control result was used to obtain the MPS of the test aerosol. The MPS was calculated from the particle sizes (P1-P6) and respective CFU counts (C1-C6) in the Andersen 6-stage impactor (Online supplementary Table 1), as shown below:
BFE results range from 1–99.9% as these values are the low (<1) and high (>99.9) detection limits which are based on the test parameters used and how the calculations are performed.
Viral filtration efficiency (VFE)
VFE is not recognized as a standard test method, but has been adapted by Nelson Laboratories[35] from the ASTM F2101 method.[13] It was included in this study because it is sometimes used by manufacturers in their marketing literature[36] and in FDA 510(k) applications for N95 FFRs with an antimicrobial/antiviral agent (16). Penetration was measured using the bacteriophage phiX174Table 3.as the challenge virus and Escherichia coli bacteria as the host. A suspension of phiX174 was aerosolized in a nebulizer and each test was performed with a challenge level of 1700-2700 plaque-forming units (PFU) with a MPS of 3.0 ± 0.3 ?m for 2 min. The virus aerosol is a water droplet containing virus and not an individual virus particle. The MPS was calculated as shown for BFE method. The unneutralized aerosol sample was drawn through a test sample clamped into the top of a 6-stage Andersen sampler with agar plates inoculated with E. coli for collection. The flow rate was maintained at 28.3 L/min. The PFUs represent the number of viral aerosol particles or droplets. The total number of viral aerosols for test samples, and positive controls without a test sample, were obtained as described for the BFE method. A negative control with no virus in the airstream was performed to determine the background challenge in the glass aerosol chamber prior to testing. The filtration efficiency was calculated using the PFU similar to the method described for BFE. Similar to BFE, VFE results range from 1 to 99.9% as these values are the low (<1) and high (>99.9) detection limits which are based on the test parameters used and how the calculations are performed.
Previous: EFFECT OF TEMPERATURE ON THE STRUCTURE AND FILTRATION PERFORMANCE OF POLYPROPYLE
N e x t : Bacterial Filtration Efficiency (BFE) For Face Mask
